

What is actually inside PROMETHEUS.
Not a dashboard bolted onto an export. A data substrate, three engines that run against it, and the working surfaces your revenue, compliance and clinical teams each need.
The data substrate
PROMETHEUS is only as good as what it can see. It reads from the systems your program already feeds, rather than asking you to assemble a new one.
| Source | What it contributes | Access |
|---|---|---|
| Encounter & claim data | Professional, institutional and pharmacy encounters, diagnosis history, provider references — the record CMS is actually scoring. | Read-only, tenant-scoped |
| Submission acknowledgments | EDS and RAPS responses, MAO-002 and MAO-004 files: what CMS accepted, what it rejected, and what it never acknowledged at all. | Read-only |
| Enrollment & capitation | Member roster and monthly membership / capitation detail, so revenue figures reconcile to what you were actually paid. | Read-only |
| Community clinical data | TEFCA / HIE / QHIN records for care delivered outside your four walls — evidence for conditions your own encounters never saw. | Query, consent-governed |
Tenant scoping is enforced three times, not once. The service account is restricted to a read-only role; every query is parameterized with the tenant identifier; and the tenant is resolved from the authenticated user's own token rather than from anything the browser sends. One PACE organization cannot see another's data — and that is verified by automated test, not by policy.
Three engines, running together
Each answers a different question. They run concurrently against the same substrate, so the three answers are always as of the same moment.
Recapture
Which conditions are supported by evidence but missing from the data CMS scored — and what each one is worth. Produces the gap registry, ranked by revenue with days-open aging.
Encounter quality
Which submissions were accepted, rejected, or never acknowledged; which rejection codes cluster; and which provider or workflow is generating them. Produces the pipeline view and the EQS score.
RAF & capitation
Every participant scored the way CMS pays PACE: the raw model score normalized, coding-adjusted, blended at the published PACE weights, with the organization's frailty score added — the paid-equivalent RAF, with the raw score shown beside it. Verified score for score against CMS's own model software before every release.
The surfaces people actually work in
Nine dashboard views, My Worklist, My Reports, Month-End Close and the deeper registries. Daily Pulse is the default; the rest are one click away.
My Worklist
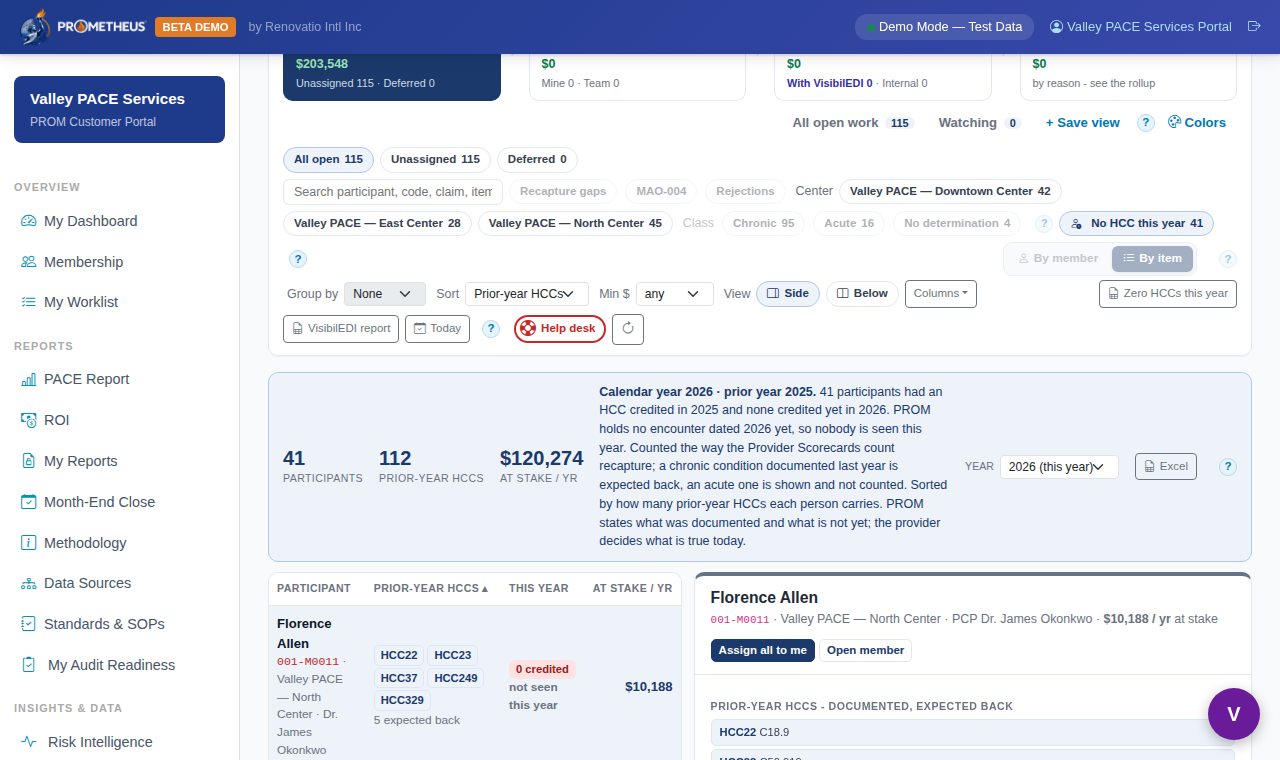
Where a working day starts. One item per participant and condition, whatever the source — a condition documented last year and not this year, a diagnosis CMS rejected, an encounter CMS has not acknowledged — with what it is worth this payment year, the CMS run that makes it late, its MAO-004 state, who holds it and when it is due. It flows the way work flows: Open, Active, Pending, Closed.
- Two grains, one list: by member gathers everything open on one participant; by item is the flat queue, opened as a split view — the list on the left, the work panel on the right with the claim, why it is here, Vanessa's next steps (each with a chip saying where it came from and whether it is verified for PACE), notes, history and the record
- Four actions, and every one sets a follow-up date: Assign, Defer, Worked, Send to VisibilEDI. A strip at the top counts overdue, due today and due soon from those dates — never guessed
- Ranked by what each claim adds — Net New HCC: CMS pays an HCC once per participant per year, so a rejected claim whose category is already credited, already submitted and awaiting CMS, or outranked in the CMS hierarchy reads $0 and says why, naming the encounter that carries it; a higher category over a lower one already in is priced at the difference only. Net New Diag, one click away, shows every claim at its own value — priced from your own MAO-004 reconciliation, not an average
- No HCC this year: one click lists the participants with a condition credited last year and none credited yet this year, by how many are expected back — drawn from the roster, with the documented codes, what is awaiting CMS and an Excel export. PROMETHEUS never suggests a diagnosis; the chart and the provider decide
Synthetic demonstration data — no real participant information.
Provider scorecards and member RAF
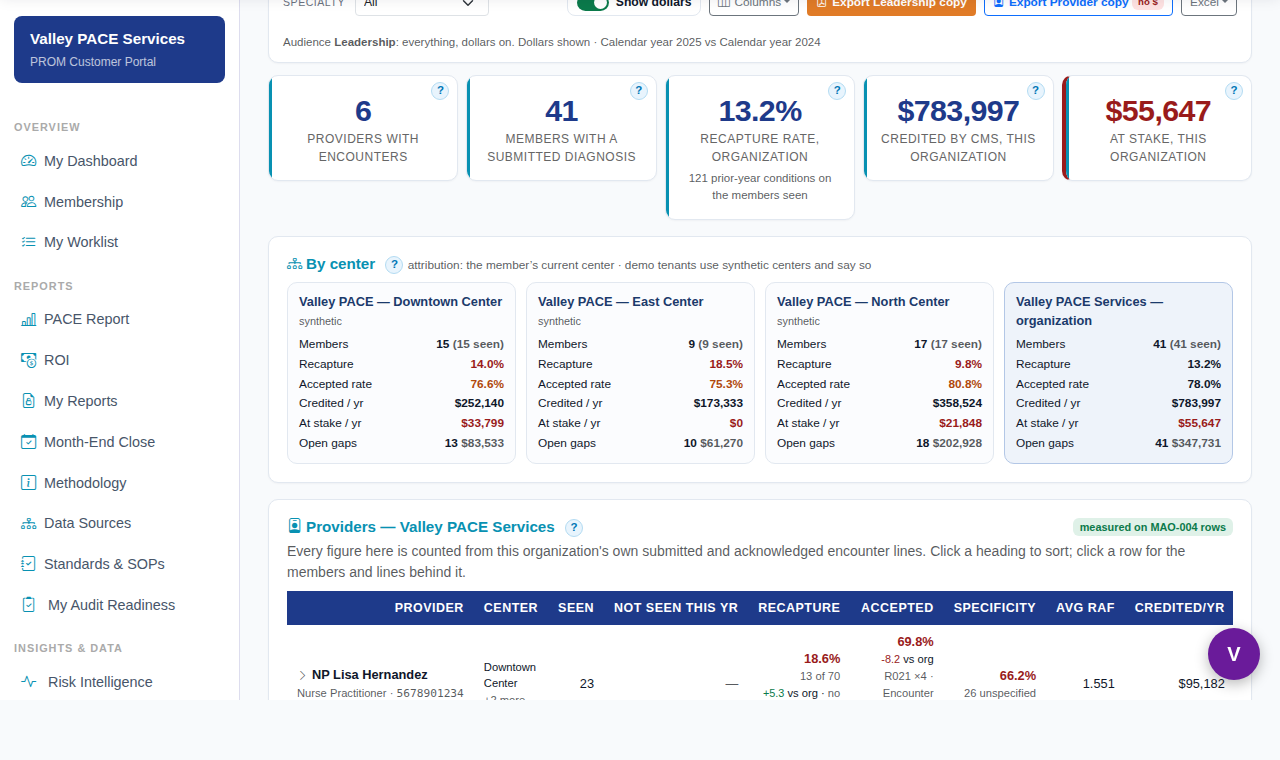
Every figure counted from your own submitted and acknowledged encounter lines, for each provider and then each center: lines accepted, rejected and not seen; what CMS is paying for the provider's accepted diagnoses and what is at stake on the rest; open gaps; the recapture rate on a named chronic basis — your own chronic / acute list first, then the federal one; specificity. Every column is counted or says it is not — a comparison against the organization, never a rank. In the beta, the Risk Intelligence screen reads demonstration content and carries a badge that says so; it is being rebuilt from measured data. The member RAF ledger and the methodology register read from your data.
- Two documents from one calculation: the leadership copy with dollars, the provider copy without, both PDF and workbook
- Member RAF, HCC composition and interaction terms
- Methodology tab exposing every coefficient and assumption in use
Synthetic demonstration data — no real participant information.
My Reports
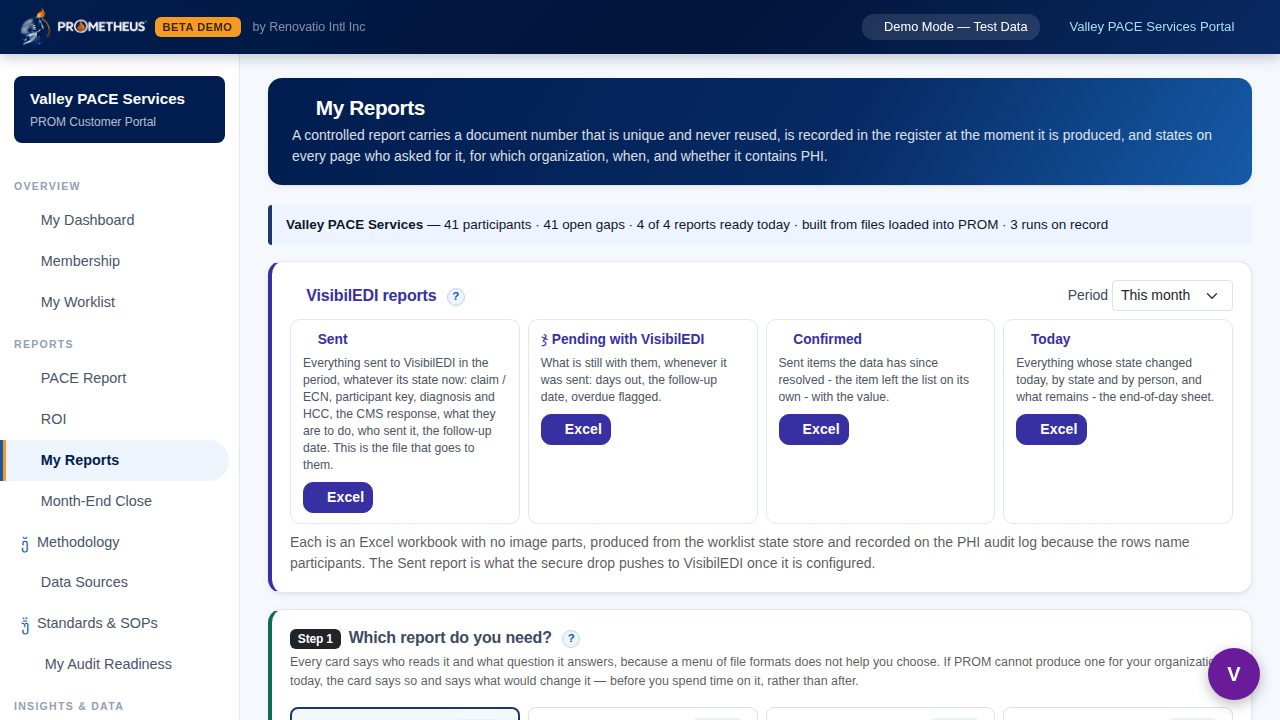
Every report says who reads it and what question it answers before you spend time on it. Each is a controlled document: a number that is never reused, recorded in the register the moment it is produced, stating on every page who asked for it, for which organization, when, and whether it contains PHI.
- The VisibilEDI cards: Sent (everything sent in the period and where it is now), Pending with VisibilEDI (days out, overdue flagged), Confirmed (sent and now resolved by CMS's own file) and Today — each as Excel
- Report Pack, Working List, Month-End Review, Revenue Bridge and the rest, each with who reads it and what it answers; if PROMETHEUS cannot produce one for your organization today, the card says so and what would change it
- Beside it, the ROI page: Confirmed, Awaiting results and the fee for the period, with the multiple — confirmed means CMS's file shows it
Synthetic demonstration data — no real participant information.
Daily Pulse
Executive KPIs recalculated against current data — gaps, revenue at risk, average RAF, acceptance rate, encounter quality score and annual capitation.
Submission pipeline
Every batch from generation through CMS acknowledgment, with rejection reasons grouped by cause rather than listed by the thousand.
RAF, and what changes it
What you will be paid on today's evidence, when CMS can next change it (a step chart on the CMS run dates), what must close before each run and who holds it, and the bridge from raw score to paid-equivalent. What is above the measured line is labeled as at stake, not forecast.
Live stream
Events as they happen — submissions, acknowledgments, gap closures — so the operations team is not waiting on a nightly report.
Your measured figures, period over period
Every report carries the fingerprint of the data behind it, so movement between two runs is real and reproducible. PROMETHEUS shows no peer figure it cannot stand behind; a peer comparison arrives when a licensed benchmark is sourced, and the screen says so until then.
External evidence
Community clinical records that support a condition your own encounters never captured, surfaced next to the gap they resolve.
Claims-to-CMS reconciliation
Every submitted diagnosis in one of five states — credited, accepted but priced by no HCC, rejected, not seen by CMS, awaiting — with the reason, the fix path and the dollars, counted once per member and HCC. The imbalance between what your claims support and what CMS credited, with the members behind it.
Month-End Close
A close calendar, an editable checklist, a configurable evidence pack with a manifest (report job id, data hash, build, engine checksum, file hashes) and a sign-off. A closed month is read-only; reopening needs a reason and keeps the history.
Centers
Every center side by side: participants, average risk, annual capitation, open gaps and revenue at risk, ranked. The organization average is participant-weighted — a 6,858-participant center and a 120-participant one cannot carry equal weight — and the panel prints what an average-of-averages would have given instead, so the choice is visible rather than assumed. Center totals are computed over the full participant and gap sets, never the lists capped for display.
Diagnosis History
One row per participant per diagnosis per year: accepted by CMS, still in the claim system, or neither — with what each is worth. The question a coder actually asks, which is which of last year’s conditions have not come back this year.
Methodology & Adjustments
Every formula behind every figure: the arithmetic, each input with its source, whether it is CMS-published and locked or plan-configured, why it is built that way, and — first-class, not fine print — what it does not account for. Each one is recomputed from its published parts and compared against your own numbers on every build; a disagreement fails the build. Configurable inputs carry a propose-and-approve trail.
Runs of record
Every report generation is a run with an id, a period, a digest of the data behind it, the build and the engine checksum. Regenerate unchanged data and PROMETHEUS hands back the same run and says so; if the data has moved you get a new one and it says that too. Two runs with the same data digest were scored on identical rows by identical code.
Help on every screen
A (?) on every tile and panel. One red life ring is the help desk everywhere: from a worklist row it raises a ticket with your notes attached. Vanessa answers from the help library, names her source, and hands you to a person when she is outside it. Ten onboarding modules with a two-question check each.
The part most vendors don't show you
Software that touches revenue has to be operable. PROMETHEUS ships the monitoring and diagnostics layer as a product surface, not as an internal tool.
Data Link Console
The read-only link to your data mart, shown rather than asserted: the tunnel and login probe, a schema contract check that reports breaking changes as zero or not, the table inventory with row counts and what each table unlocks, a load log that records every change, and a column profile with a masked sample.
Operations center
Per-organization health scoring over time, alert rules with routing and escalation, data-freshness monitoring and a named analyst assignment — so a stalled feed is noticed by us before it is noticed by you.
Diagnostics & error codes
Every failure carries a structured code across eleven domains, with a customer-facing error card that explains what happened and what to do. Support can search failures, detect clusters across organizations, replay a job with its original parameters, and read a timeline of exactly where it spent its time.
Generate, don't submit. PROMETHEUS produces submission-ready output and holds it. Transmission to CMS is a separate, explicit action, taken by a person, in a mode that has to be deliberately enabled — and every transmission is individually audited. The software never quietly files something on your behalf.
Best understood by driving it.
Thirty minutes on a live synthetic PACE dataset, with your questions rather than our script.